

By Chris Bruen
Chris Bruen is Senior Director of Research and Chief Economist, with primary responsibility for aiding in and expanding upon NMHC’s research in housing and economics. Chris holds a bachelor’s degree in Finance from The George Washington University and an M.S. in Economics from Johns Hopkins University.
Housing economists have agreed for many years that the U.S. is short millions of housing units, constraining affordability and limiting options for renters and owners. Yet how can this be true with record levels of apartment completions in many metro areas around the country? This Research Notes explains why we are observing both of these phenomena simultaneously. While there are short-term supply imbalances in certain markets, examining longer-term trends in household formation reveals longer-term underbuilding.
Quantifying the Housing Shortage
A range of studies underscore how large our nation’s housing shortage has become.
- Freddie Mac, for example, estimates a shortfall of 3.7 million housing units as of the third quarter of 2024;
- Researchers at the Brookings Institution calculated a shortage of 4.9 million housing units in 2023 relative to the mid-2000s; and
- A 2022 study by Hoyt Advisory Services and Eigen10 Advisors estimated that, as of 2021, the U.S. was short 600,000 apartment units (units in structures with five or more units).
Yet this seems difficult to reconcile, particularly in the apartment segment, when the share of vacant apartments is the highest it’s been in decades. According to data from CoStar, the multifamily vacancy rate rose to 8.3% in 4Q 2024 (the highest rate since record keeping began in 2000) before falling slightly to 8.2% during the first half of 2025.
Two Different Meanings of “Shortage”
There is no contradiction here, however, there does seem to be some confusion. The confusion stems from the fact that we are using the term “shortage” to refer to two very different concepts:
- The traditional, textbook definition of a shortage—what you might learn in an introductory economics class—when the quantity of housing demanded exceeds the quantity supplied at current market prices. This imbalance causes prices (or rents) to increase until the shortage (in theory) disappears.
- The definition employed by entities, such as Freddie Mac and the Brookings Institution, which incorporates “latent” or “pent-up” demand for housing—individuals who would have formed their own household if housing costs were lower or more affordable but instead live with roommates or family members.
The textbook definition might be an appropriate characterization of the apartment market during the latter part of 2021, when the multifamily vacancy rate fell to a record-low 4.9% in the third quarter. Record-low vacancy was then followed by record-high rent growth shortly after, with effective asking rents rising 9.4% year over year (YOY) in 1Q 2022. Shortages were even more acute in metros such as the Inland Empire, CA, which recorded a multifamily vacancy rate of 2.2% in 3Q 2021, New York City (2.6%), and San Diego, CA (2.7%).
Yet this period of low vacancies and high rent growth – coupled with low interest rates – prompted a surge in multifamily construction. Multifamily completions rose 22.1% in 2023 and an additional 35.0% in 2024 to 591,700 units, according to data from the U.S. Census Bureau, marking the highest level of new apartment units since 1974. Moreover, this wave of new supply is now translating into higher vacancies and low-to-negative rent growth. Here are several examples:
- Austin, TX, which posted a multifamily vacancy rate of 15.4% in 2Q 2025, saw effective asking rents decline 4.3% YOY, according to data from CoStar;
- Naples, FL had a second quarter vacancy rate of 15.7% and saw multifamily rents decrease 4.7% YOY; and
- Phoenix, AZ recorded a 12.0% vacancy and -2.7% annual apartment rent growth in 2Q 2025.
These metros fit with the traditional definition of a market surplus (as opposed to shortage): vacancies are too high and so prices (rents) are falling.
Note that this first definition of a shortage/surplus is both short term and usually self-correcting: if vacancy rates are too low/high, housing providers will simply raise/lower rents until the market returns to balance. Evidence of this can be seen by the declines or slowing rent growth in many of these surplus areas.
Our second definition of a housing shortage, however—that employed by institutions such as Freddie Mac and the Brookings Institution—captures more long-term, structural issues within the housing market that account for “pent-up” demand. Specifically, Freddie and Brookings estimate how many households would have been formed if housing costs didn’t increase as much as they did since some reference year—the year 2000, in the case of Freddie Mac or 2006 in the case of Brookings.
The relationship between housing costs and household formation
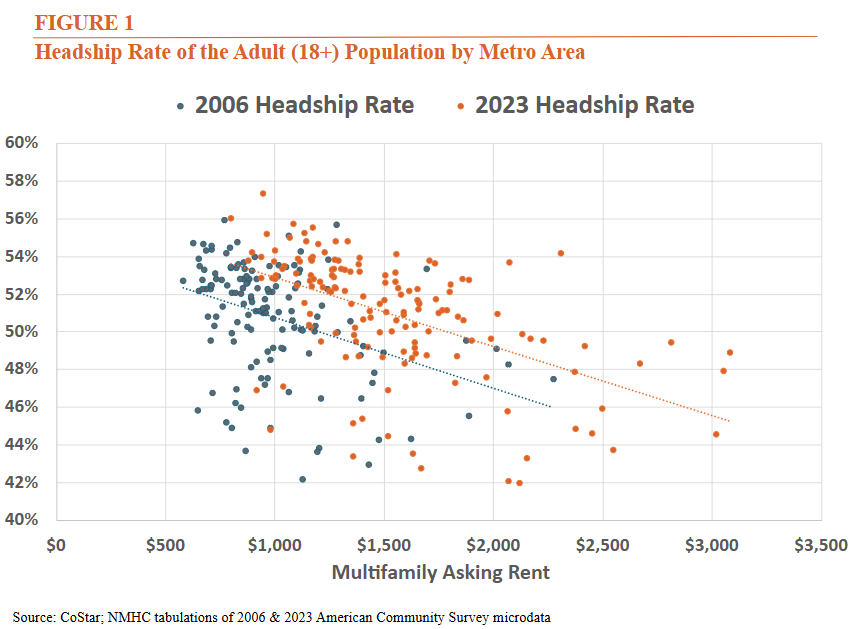
Figure 1 below shows how in both 2006 and 2023, metro areas1 with higher housing costs tended to have lower headship rates (the share of adults who reported being householders), which suggests lower levels of household formation. It’s logical that individuals would be more likely to share housing costs with roommates or family members in more expensive parts of the country. We can also see how increasing housing costs between 2006 and 2023 translated to lower headship rates, on average.
When we account for demographic differences between metros, such as age, income, marital status, and educational attainment—which also tend to affect household formation rates—this relationship between rent and headship rates becomes much stronger, as can be seen in Figure 2.2
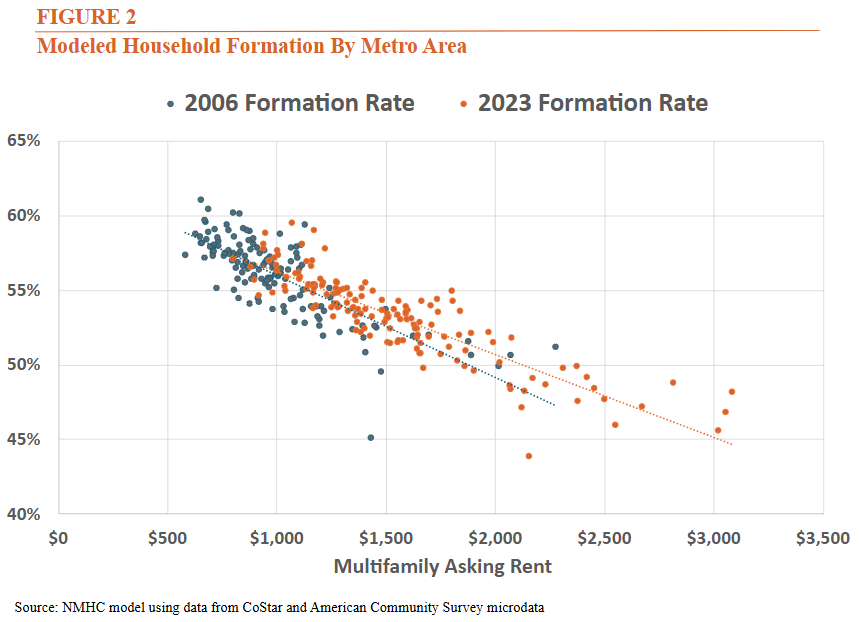
We can then use this relationship between housing costs and headship rates to estimate how many more households would have been formed if rents had increased no more than the rate of inflation from 2006 to 2023.3
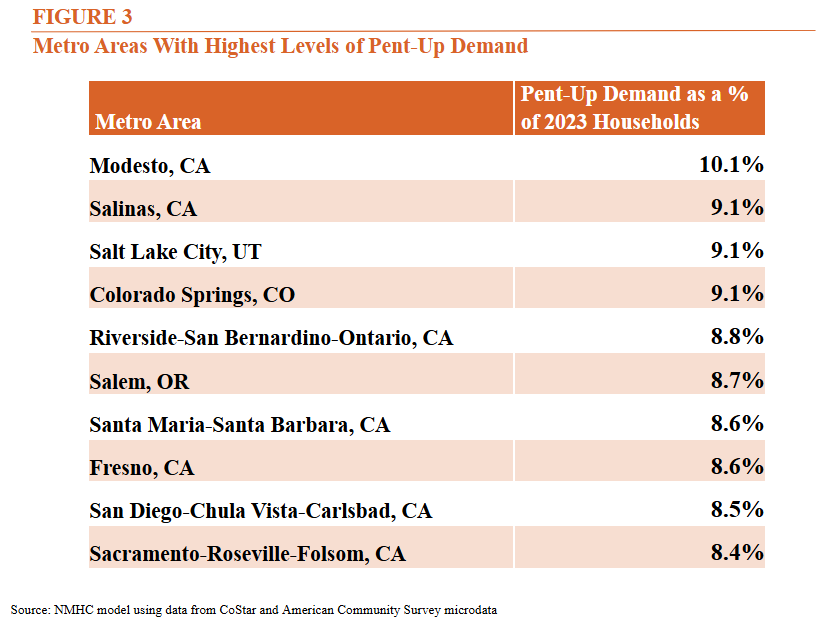
We estimate, for instance, that Modesto, CA, would have had 10.1% more households in 2023 if rents had remained at their 2006 levels (adjusted for inflation) – the greatest difference of all 150 metros analyzed – followed by Salinas, CA (9.1% more households), and Salt Lake City, UT (also 9.1% more). We can see that a majority of markets with the highest levels of pent-up demand are located in California, where housing costs have increased much more than the national average from 2006-2023.
What’s more notable, however, is that rising housing costs inhibited household formation in every single metro area studied. This is unsurprising given that housing costs increased more than the rate of inflation in each of these metros between 2006 and 2023.
Thus, according to this second definition, we might say that a metro like Austin, TX, has a shortage of housing units relative to housing demand (including “latent” or “pent-up” demand), even if the current vacancy rate is high and rents are decreasing.
Unlike our first definition, this second type of housing shortage will not resolve on its own from housing providers adjusting prices. Instead, policy intervention is needed to lower the cost of development and increase the long-run supply of housing.
1 Among the top 150 metro areas by apartment stock in 2023, according to American Community Survey microdata.
2 We run a logit model of headship rates with independent variables of age, log personal income, educational attainment, employment status, marital status, and metro area and then calculate the average probability of being a householder by metro area.
3 We model this relationship separately for each age group.
Inter-Metro Migration
Our analysis likely underestimates pent-up demand in more expensive parts of the country since it doesn’t consider inter-metro migration. High housing costs in New York and San Francisco, for example, prevent many people from living there in the first place, let alone forming a household. On the other hand, many people moved to more affordable sunbelt markets in Florida and Texas during the pandemic in part because these were relatively more affordable areas, and these markets have led the nation in construction to accommodate the newcomers.
Structural Shortage: A Longer-Term Challenge
While many U.S. housing markets are currently recording high levels of vacancy and declining rents—features that are typically associated with a housing surplus (rather than a shortage)—these markets still have a significant shortage when we consider “latent” or “pent-up” demand (individuals who would form households if housing costs were lower). Thus, when we say that the U.S. suffers from a national housing shortage, what we mean is that housing prices have increased significantly over time (more than the rate of inflation), and that this has locked many Americans out of the housing market altogether. This is true even in markets that have seen moderate rent decreases in recent years.
Unlike the traditional, textbook definition of a housing shortage—which is short-term and corrects on its own as housing providers adjust prices—a shortage that accounts for pent-up housing demand can only be addressed through lowering the cost of housing development or operations, increasing supply in the long run.
Questions or comments on Research Notes should be directed to Chris Bruen, NMHC Sr. Director of Research and Chief Economist.