
Understanding the intersection between property taxes and housing affordability
Property taxes serve as a major operating expense for housing providers as well as a dominant revenue stream for local government. All else equal, higher effective apartment property taxes increase overhead costs for housing providers; this translates into providers being forced to raise rents to offset the cost, impacting the project’s viability and/or affordability levels. Differences in effective tax rates between jurisdictions, as well as any preferences given to homesteads, are thus one important determinant of new housing development and affordability.
The Lincoln Institute of Land Policy and the Minnesota Center for Fiscal Excellence’s recently released report “50-State Property Tax Comparison Study: For Taxes Paid in 2023,” looks to capture the effective tax rates for major cities in all 50 states.
The report also explains the key drivers of variation in effective property tax rates. Among them, homestead exemptions and classifications tend to favor homeowners, leading to rental housing providers, and thus renters themselves, effectively subsidizing property taxes for homeowners.
Property taxes are another avenue for policymakers to improve housing affordability in their municipalities. In this Research Corner piece, you’ll learn where apartment industry effective property tax rates were highest in 2023, what accounts for differences in effective property tax rates, the implications of homestead exemptions and classification and the impact of property taxes on development going forward.
Apartment Property Taxes Overview
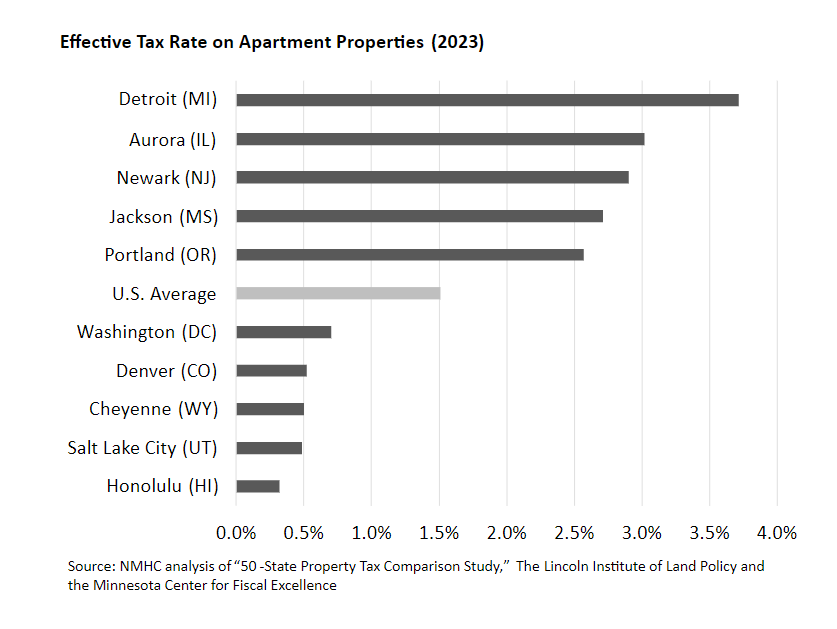
The average effective tax rate on apartments—using a fixed value of $600,000 and assuming an additional $30,000 worth of fixtures—when looking at the largest city in each state was 1.511%. [1] [2]
The highest effective apartment property tax rates were seen in Detroit, MI (3.72%), Aurora, IL (3.02%), Newark, NJ (2.91%) Jackson, MS (2.71%) and Portland, OR (2.57%), all five having tax rates at least 70% higher than the full sample average. On the low end was Honolulu, HI (0.32%), Salt Lake City, UT (0.48%), Cheyenne, WY (0.50%), Denver, CO (0.52%) and Washington, DC (0.70%).
Comparing 2022 and 2023, large decreases in effective apartment tax rates were seen in Des Moines (IA) and Chicago (IL)—both largely attributable to lowering the assessment ratio on apartment properties—and Billings (MT) due to a lowering of their mill rate (i.e., the amount of tax payable per thousand dollars of assessed property value). Large increases were seen in Boise (ID), Portland (ME) and Jacksonville (FL) from mill rate increases and in Indianapolis (IN) due to a larger share of their levy not being subject to property tax caps.
Examining differences in effective tax rates between urban and rural areas, apartment tax rates were on average 6.2% lower in the 50 select rural municipalities than the group of largest cities in each state; however, in 26 states, the largest city in that state had a lower effective rate than the selected rural municipality.
Four states had apartment effective tax rates among the top ten highest for both urban and rural municipalities—Illinois, Michigan, New Jersey and Vermont—while Colorado, Hawaii, Utah, Virginia, Washington and Wyoming ranked in the bottom ten for both urban and rural municipalities.
Why Do Tax Rates Vary by City?
The report attributes variation in city-to-city effective tax rates to four key factors, together explaining roughly two-thirds of the variation in tax rates:
1. Property tax reliance – with different revenue sources often acting as substitutes, cities that have relatively higher sales or income taxes do not need to rely as much on property taxes to raise revenue.
2. Property values – cities with higher property values can raise the same level of revenue with a lower tax rate. For that reason, the report notes that it is often the case that “higher property values lead cities to have both lower tax rates and to raise more revenue for public services.”
Policies that lower property values thus have a doubly negative effect: While apartment operators face strain from higher property taxes—those higher taxes also putting downward pressure on new development—cities will typically still collect less revenue for public services than they otherwise could. One example of such a policy would be rent control, which reduces the value of rent-regulated properties and nearby unregulated rental properties, reducing property tax revenue to the city. [3]
3. Local government spending – effective tax rates will be partially determined by local government spending, with cities that spend more needing higher property tax rates, all else equal, to cover those expenditures.
4. Property Classification – certain classes of property are given preference in the tax system such that those classes see lower effective tax rates. These preferences—which materialize through some combination of the assessment ratio, nominal tax rate, exemptions and credits, and assessment limits—are most often given to homesteads at the relative expense of commercial and apartment properties.
The extent to which apartment buildings subsidize homesteads can be captured by the ratio of the effective tax rate on apartments to that of homesteads. Doing so produces an average “apartment-homestead classification ratio” of 1.44, meaning apartments pay an effective tax rate 44% higher on average than homesteads. 
Looking again at the largest city in each state, apartment-homestead classification ratios ranged anywhere from 6.21 in Charleston (SC) to 0.59 in Bridgeport (CT). Thirty-six cities in the sample had statutory preferences favoring homesteads over apartments.
Higher property taxes translate necessarily to higher rent to cover those expenses. As the report points out, the average renter has a lower income than the average homeowner, and resultingly, preference given to homesteads relative to apartments introduces a regressive element into the tax system.
Property Taxes and Multifamily Development
Although multifamily completions remain near their highest level in decades—up 22.4% [4] from last year’s second quarter—the current construction market faces considerable headwinds:
- Permits (5+ units in structure) fell 7% from last quarter to a seasonally adjusted annual rate (SAAR) of 419,700, according to data from the U.S. Census Bureau, down 20.3% from 2Q 2023 and 38.8% from the local peak reached in 2Q 2022.
- Multifamily starts (5+) tracked by the Census Bureau pulled back 0.5% in 2Q 2024 to a SAAR of 329,700, marking a 35.1% decrease from the previous year.

With a high interest rate environment and increasing costs, multifamily construction has pulled back considerably. Policymakers have tangible influence here, with policies that lead to lower property values (i.e., rent control) often translating to both higher tax rates and suppressed local revenue. Higher property taxes also necessitate higher rents, introducing a regressive element into the tax system when paired with the typical preference given to homesteads.
Whether through tax abatement programs or by bringing into alignment the effective tax burden faced by different property types, the realm of property taxes offers one important mechanism to spur increased housing development and affordability. To learn more about the state and local policies that impact housing affordability, including tax abatement, see The Housing Affordability Toolkit. To read more about NHMC’s involvement on tax related issues, visit https://www.nmhc.org/industry-topics/tax-and-accounting/.
Notes:
1. Effective tax rates were calculated using fixed property values to compare across cities without the confounding factor of differing property values. Although this allows for more effective cross-market comparison of effective tax rates, it can lead to over or under estimation of net tax bills depending on property values.
2. The sample included DC as well as the second largest city in both New York and Illinois as property taxes in New York City and Chicago differ considerably from those in the rest of their respective states.
3. NMHC | NMHC Report: Rent Regulation Policy in the United States
4. New Residential Construction, U.S. Census Bureau.
About Ryan Hecker
 Ryan Hecker was NMHC's Research Analyst, providing support for NMHC's research in housing and apartment industry trends. He graduated from the University of Rochester with a bachelor's degree in Economics and Political Science. Ryan's internship experience includes work on the Committee for a Responsible Federal Budget (CRFB)'s policy team and on FGS Global's government affairs team, where he aided in research on debt solutions and macroeconomic projections as well as covering of congressional hearings.