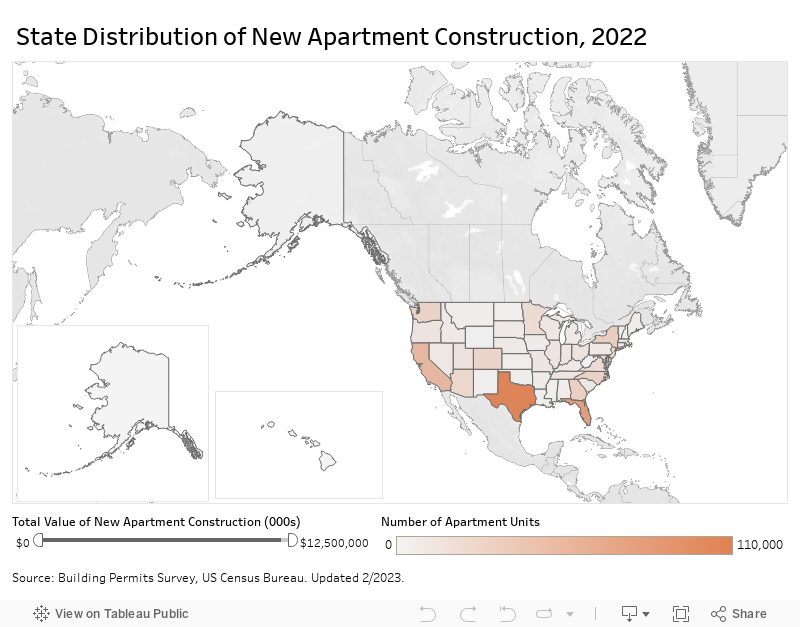
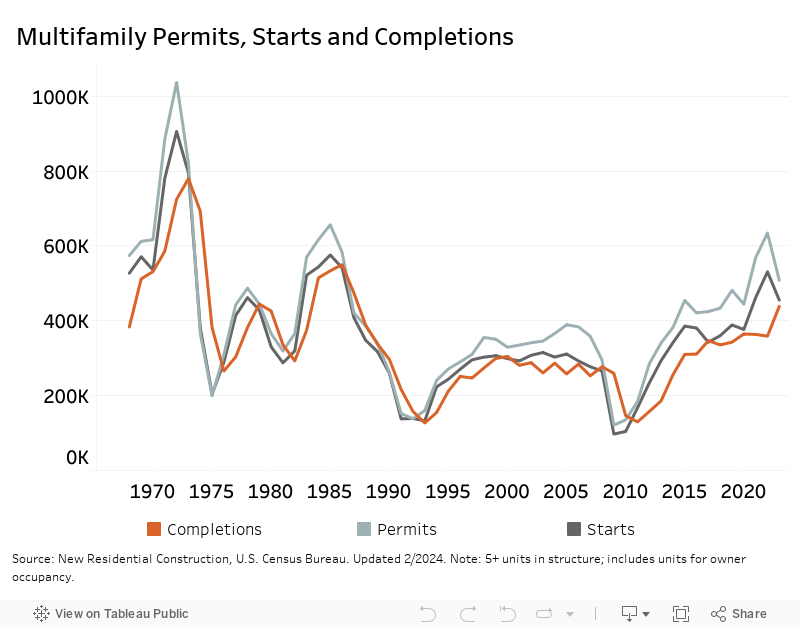
New Construction includes estimates of the economic impact of apartment construction and renovation, a state distribution of new apartment construction, activity in Low Income Housing Tax Credit construction, and multifamily permits, starts, and completions over time.
For the best data visualization experience, please visit this page on a computer.
Economic Impact
Apartment construction contributes annually:
$226.3 billion and 1,000,000 jobs
Apartment renovation and repair/capital expenditures contributes annually:
$77.0 billion and 378,000 jobs
To see the impact of construction by number of units for the U.S. and individual states, as well as the impact of operations and renter spending, use "NMHC’s Apartment Community Estimator” calculator.
Source: Hoyt Advisory Services, National Apartment Association and National Multifamily Housing Council, “The Contribution of Multifamily Housing to the U.S. Economy”
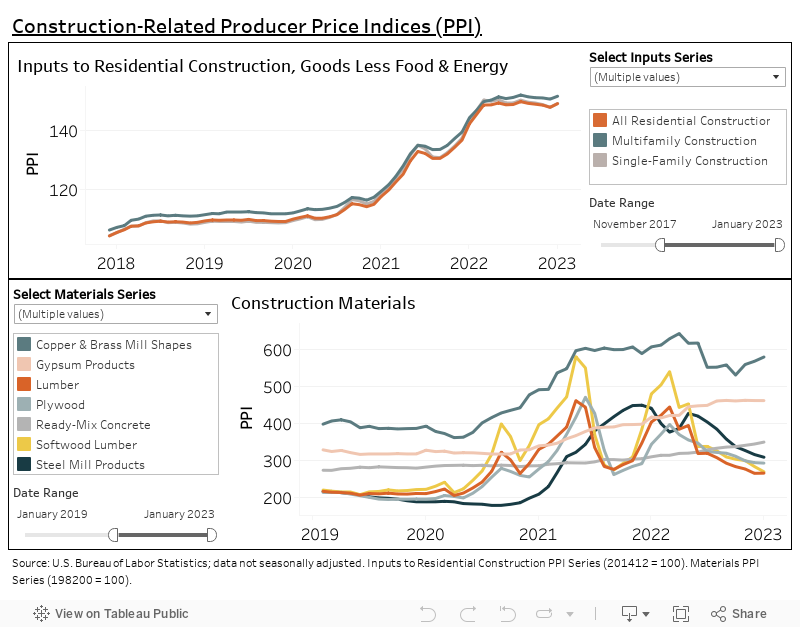
The Producer Price Index from the U.S. Bureau of Labor Statistics measures average change in price over time for goods and services. Released on a monthly basis, the series included below for inputs to residential construction began in 2014 and the series for materials began in 1982. Both charts allow users to select individual series and toggle the date ranges.
Low-Income Housing Tax Credit Construction Activity
| 9% Credit | 4%/Tax Exempt Bond Credit | Total | |||||||
|---|---|---|---|---|---|---|---|---|---|
| Year | New Construction | Rehab | Total | New Construction | Rehab | Total | New Construction | Rehab | Total |
| 1987 | N/A | N/A | N/A | N/A | N/A | N/A | N/A | N/A | 34,491 |
| 1988 | N/A | N/A | N/A | N/A | N/A | N/A | N/A | N/A | 81,408 |
| 1989 | N/A | N/A | N/A | N/A | N/A | N/A | N/A | N/A | 126,200 |
| 1990 | N/A | N/A | N/A | N/A | N/A | N/A | N/A | N/A | 74,029 |
| 1991 | N/A | N/A | N/A | N/A | N/A | N/A | N/A | N/A | 111,970 |
| 1992 | N/A | N/A | N/A | N/A | N/A | N/A | N/A | N/A | 91,300 |
| 1993 | 68,105 | 40,204 | 108,309 | N/A | N/A | 2,658 | N/A | N/A | 110,967 |
| 1994 | 75,433 | 44,242 | 119,675 | N/A | N/A | N/A | N/A | N/A | 119,675 |
| 1995 | 55,807 | 30,291 | 88,843 | 4,606 | 5,906 | 10,512 | 60,413 | 36,197 | 99,355 |
| 1996 | 50,251 | 29,252 | 79,503 | 7,878 | 7,325 | 15,203 | 58,129 | 36,577 | 94,706 |
| 1997 | 50,301 | 22,776 | 73,077 | 9,978 | 8,997 | 18,975 | 60,279 | 31,773 | 92,052 |
| 1998 | 51,162 | 21,914 | 73,076 | 16,573 | 13,466 | 30,039 | 67,735 | 35,380 | 103,115 |
| 1999 | 49,999 | 18,153 | 68,152 | 22,374 | 17,832 | 40,206 | 72,373 | 35,985 | 108,358 |
| 2000 | 47,154 | 18,738 | 65,892 | 32,962 | 19,308 | 54,048 | 80,116 | 38,046 | 119,940 |
| 2001 | 55,370 | 18,520 | 74,929 | 28,254 | 26,962 | 55,216 | 83,624 | 45,482 | 130,145 |
| 2002 | 53,790 | 20,273 | 74,063 | 35,847 | 25,523 | 61,370 | 89,637 | 45,796 | 135,433 |
| 2003 | 54,819 | 22,962 | 78,505 | 38,878 | 23,728 | 62,606 | 93,697 | 46,690 | 141,111 |
| 2004 | 48,299 | 22,251 | 79,923 | 37,340 | 28,732 | 70,260 | 85,639 | 50,983 | 150,183 |
| 2005 | 49,010 | 23,805 | 73,178 | 34,361 | 34,847 | 69,218 | 83,371 | 58,652 | 142,396 |
| 2006 | 50,949 | 23,443 | 74,392 | 30,435 | 34,968 | 65,403 | 81,384 | 58,411 | 139,795 |
| 2007 | 52,382 | 24,759 | 77,141 | 28,829 | 40,283 | 69,112 | 81,211 | 65,042 | 146,253 |
| 2008 | 54,105 | 28,954 | 83,062 | 22,206 | 37,548 | 59,754 | 76,311 | 66,502 | 142,816 |
| 2009 | 43,186 | 25,562 | 68,748 | 16,802 | 27,316 | 44,118 | 59,988 | 52,878 | 112,866 |
| 2010 | 38,367 | 15,448 | 58,890 | 12,033 | 24,391 | 36,424 | 50,400 | 39,839 | 95,314 |
| 2011 | 29,339 | 20,982 | 50,321 | 17,273 | 26,358 | 43,631 | 46,612 | 47,340 | 93,952 |
| 2012 | 33,583 | 23,800 | 57,383 | 10,222 | 30,970 | 41,192 | 43,805 | 54,770 | 98,575 |
| 2013 | 36,602 | 20,099 | 56,701 | 15,290 | 32,901 | 48,191 | 51,892 | 53,000 | 104,892 |
| 2014 | 39,143 | 21,409 | 60,552 | 12,203 | 26,538 | 38,741 | 51,346 | 47,947 | 99,293 |
| 2015 | 40,779 | 20,526 | 61,305 | 20,863 | 31,766 | 52,629 | 61,642 | 52,292 | 113,934 |
| 2016 | 40,969 | 15,420 | 56,389 | 15,791 | 39,155 | 54,946 | 56,760 | 54,575 | 111,335 |
| 2017 | 42,488 | 17,243 | 59,731 | 20,684 | 37,048 | 57,732 | 63,172 | 54,291 | 117,463 |
| 2018 | 47,446 | 15,468 | 62,914 | 26,691 | 46,857 | 73,548 | 74,137 | 62,325 | 136,462 |
| 2019 | 51,228 | 17,842 | 69,070 | 29,281 | 43,448 | 72,729 | 80,509 | 61,290 | 141,799 |
| 2020 | 49,695 | 13,545 | 63,240 | 31,966 | 56,989 | 88,955 | 81,661 | 70,534 | 152,195 |
| 2021 | 58,583 | 16,323 | 74,906 | 33,000 | 47,735 | 80,735 | 91,583 | 64,058 | 155,641 |
| 2022 | 40,425 | 10,614 | 51,039 | 27,253 | 30,981 | 58,234 | 67,678 | 41,595 | 109,273 |
| 2023 | 53,151 | 10,848 | 63,999 | 43,508 | 48,609 | 92,117 | 96,659 | 59,457 | 156,116 |
|
Notes: Totals for 1987 through 1994 do not include 4%/tax exempt bond credits and only low-income units. Totals for 9% credits from 2009 through 2019 do not include units built/repaired in that current year that received allocations in previous years. Source: National Council of State Housing Agencies. Updated 1/2025. |
|||||||||