

By Chris Bruen and Ryan Hecker
Chris Bruen Senior Director of Research, with primary responsibility for aiding in and expanding upon NMHC’s research in housing and economics. Chris holds a bachelor’s degree in Finance from The George Washington University and an M.S. in Economics from Johns Hopkins University. He can be reached at cbruen@nmhc.org.
Ryan Hecker, Research Analyst, provides support for NMHC's research in housing and apartment industry trends. He graduated from the University of Rochester with a bachelor's degree in Economics and Political Science. He can be reached at rhecker@nmhc.org.
Record-high rent growth in late 2021 and early 2022 was followed by the highest level of multifamily construction since the late 1980s. Multifamily starts rose 14.9% in 2022 to 531,000 units, according to data from the U.S. Census Bureau, their highest level since 1986. A logical conclusion would be that this rent growth fueled developer interest in the asset class, causing construction to increase. This conclusion is also reinforced by the fact that in many metro areas where a lot of development has been occurring, starts have begun to decrease significantly.
Yet, developers are incentivized not just by current rents but also by the expectation of future net operating income (rents minus operating expenses) – as well as by the cost of debt and equity capital – all of which get reflected in the price of apartment properties.
More specifically, the expectation of higher net operating income in the future should translate to higher investor demand for apartment properties and, thus, higher values/prices today. Conversely, a higher cost of capital (i.e., higher interest rates and higher returns that can be earned in other equity markets) should translate to lower demand to own apartment properties and lower prices, all else being equal. In this Research Notes, we examine whether developers do in fact respond to apartment returns, which are driven largely by price appreciation.
Apartment Returns and Starts Over Time
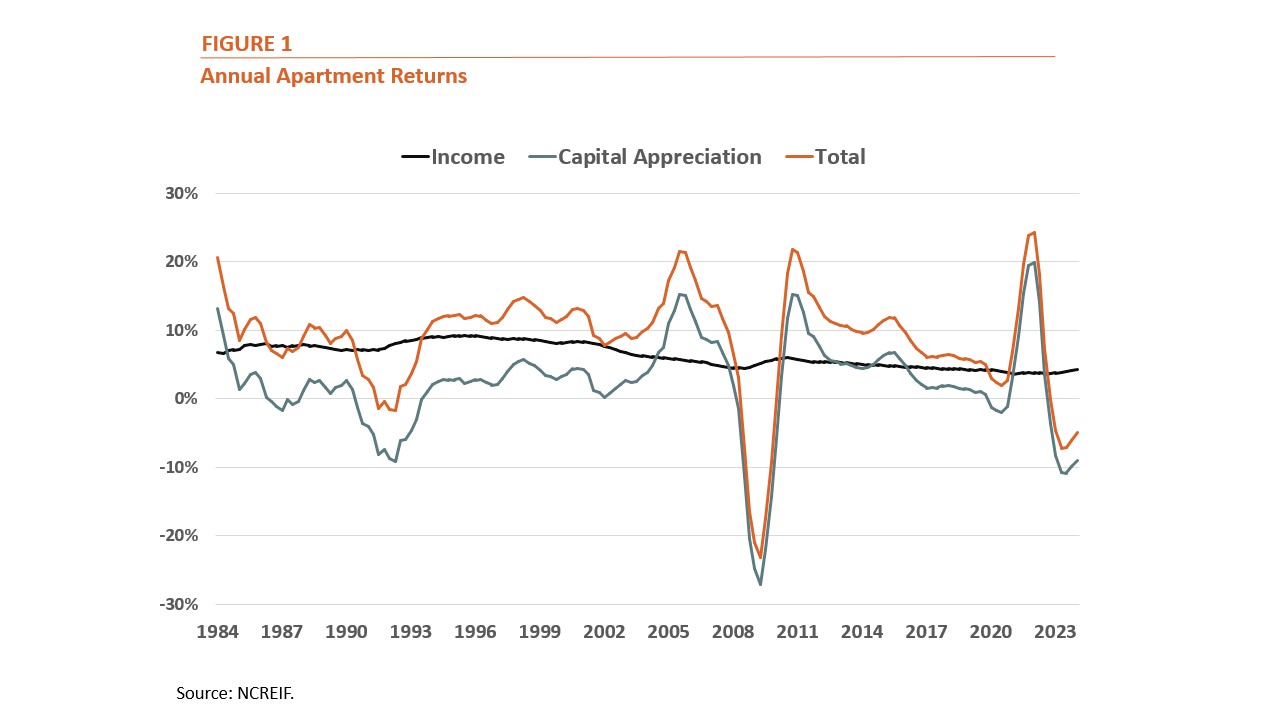
Data from the National Council of Real Estate Investment Fiduciaries (NCREIF) show that total, unlevered returns for apartment investors averaged 8.2% annually over the past 40 years. However, returns have been lower in recent years, averaging 6.0% annually over the last decade and 4.2% over the past five years. We can see from Figure 1 that volatility in apartment returns is driven primarily by changes in the price of apartment properties as opposed to the income that they produce, which has remained relatively constant over time.

Since 2000, there have been two periods of significant volatility in returns, corresponding with the Great Recession (2007-2009) and the aftermath of the COVID-19 pandemic (2021-2023). These large swings provide a unique opportunity to observe the relationship between returns and subsequent changes in multifamily construction activity.
The Great Recession (2007-2009)
The Global Financial Crisis of 2007-2008 and corresponding Great Recession saw demand for apartments retreat, causing annual apartment returns to fall to a low of -23.2% by 3Q 2009.
- The Great Recession saw the U.S. unemployment rate rise from 4.4% in May of 2007 to double digits (10.0%) in October of 2009 and Real GDP fall 4.0% between 2Q 2008 and 2Q 2009, acting as a headwind to renter demand.
- Effective asking rents for apartments tracked by CoStar fell 4.0% year over year by the fourth quarter of 2009, while the stabilized vacancy rate rose to 7.5% (up from the 6.4% vacancy reached just three years earlier).
- Since the Federal Reserve responded aggressively to the Great Recession by lowering its federal funds rate from 5.25% in 2007 to 0% by the end of 2008 – which translated to a sizeable drop in the 10-Year Treasury Yield as well – we can surmise that the negative returns during this period were primarily driven by the pullback in demand, not any high costs to borrow.
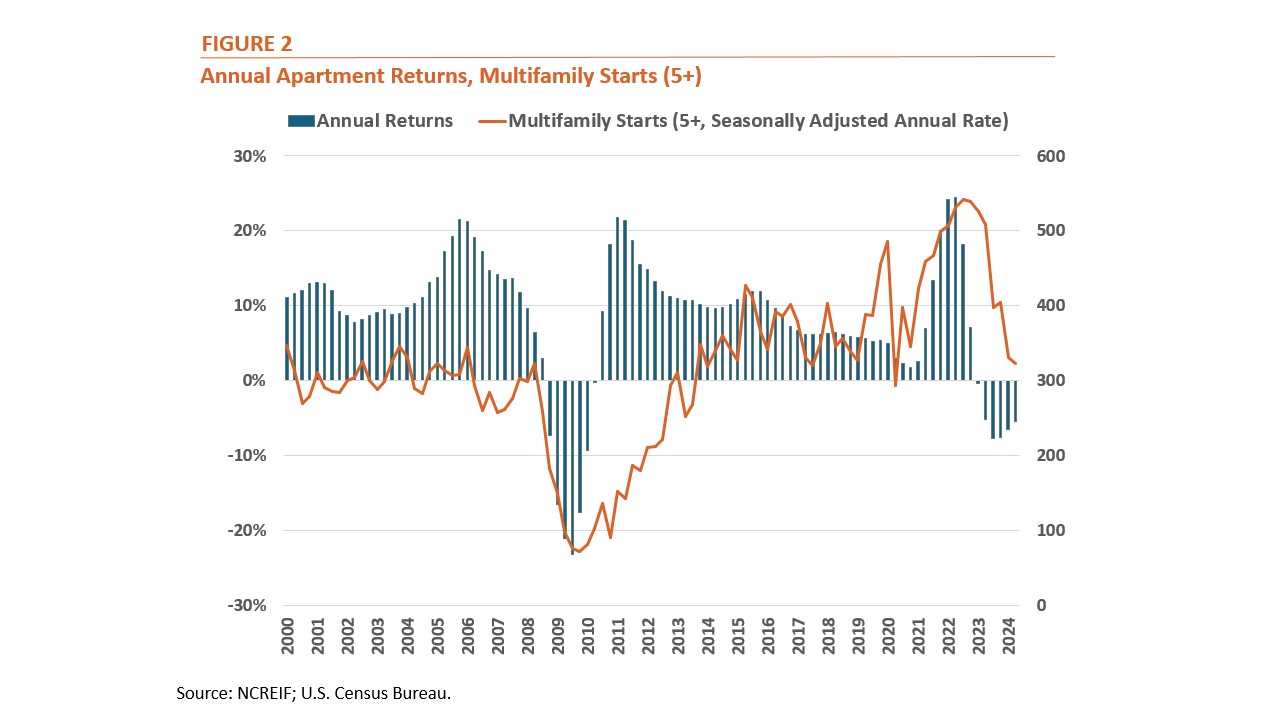
These large, negative returns for apartment investors in 2009 coincided with a significant decrease in new construction. Multifamily starts (5+ units in structure) fell 63.4% in 2009 to just 97,300 units, according to data from the U.S. Census Bureau, the lowest number since records began in 1964.
Returns for apartment investors rebounded strongly in late 2010 and 2011 – peaking at 21.8% year over year in 1Q 2021 – and remained elevated in the subsequent years. We can see from Figure 2 that multifamily starts picked up as well in 2010 and 2011. However, it wasn’t until 2013 when the pace of multifamily starts returned to pre-2009 levels.

The COVID-19 Period
Record-high rent growth coupled with lower interest rates caused annual apartment returns to climb to a peak of 24.5% in 2Q 2022, according to data from NCREIF.
- Annual growth of effective asking rents tracked by CoStar reached a record-high 11.0% in 1Q 2022.
- After the outbreak of COVID-19 in March 2020, the Federal Reserve lowered its federal funds target range to 0-0.25% and kept it there until March of 2022. From the beginning of 2020 until the end of 2Q 2022, the average 10-Year Treasury yield was just 1.42%.
We can see from Figure 2 that this surge in returns corresponded to a sizeable increase in construction activity. Multifamily starts rose 22.6% in 2021 and then by an additional 14.9% in 2022 to 531,000 units, the highest level of starts since 1986.
Annual apartment returns proceeded to turn negative in 2023, reaching -7.65% in 3Q 2023. In contrast to the negative returns recorded during the Great Recession – which were driven by falling demand and occurred in spite of very low interest rates – the negative apartment returns recorded in 2023 can be attributed more to rising interest rates, moderating rent growth from an increase in new supply, as well as rising operating costs.
- Elevated starts in 2021 and 2022 translated to a 22.1% increase in multifamily completions in 2023 to 438,300 units, according to the U.S. Census Bureau, the highest level since 1987.
- This increase in supply had a downward effect on rent growth; annual effective rent growth reached just 0.7% in 4Q 2023 among multifamily units tracked by CoStar.
- Meanwhile, the Federal Reserve raised its federal funds target range from 0-0.25% in February 2022 to 5.25-5.50% by July 2023, which stood until the Fed’s 50 basis-point cut last week. The 10-Year Treasury, in turn, rose from 0.65% in 3Q 2020 to 4.45% in 4Q 2023.
- Apartment operating costs increased 10.3% in 2022, according to data from Yardi, and then by an additional 7.1% in 2023. Certain line items increased by an even greater amount. For instance, insurance costs per unit rose 18.8% in 2022 and then by 35.3% in 2023.
Just as the period of higher apartment returns in 2021 and 2022 corresponded to an increase in multifamily development, this period of falling to negative returns in late 2022 and 2023 was followed by a sharp pullback in new construction. Data from the Census Bureau indicate that multifamily starts have fallen 37.1% between Q2 2023 and Q2 2024.
The Takeaway
Developers of multifamily housing are incentivized not just by current rents but also by the expectation of future net operating income – determined by future rents and operating costs – and the cost of capital, all of which are reflected in returns to investors.
While strong returns in 2021 and 2022 were followed by a period of elevated new construction – completions reaching their highest level since 1987 – this recent period of negative returns has coincided with a sharp pull back in development activity, deepening an existing long-term shortage of housing and putting further pressure on affordability.
The relationship between returns and new supply also highlights the impact of operating costs and the cost of capital. Unlike during the Great Recession, demand for apartments today remains strong, with negative returns more so reflecting a high-interest rate environment coupled with low rent growth and rising operating costs.
In this context, the Fed’s recent 50-bps cut will help ease the burden on developers and hopefully spur on much needed new construction, but the other impediments, low rent growth and rising operating costs, remain. While the current pullback in new construction will likely lead to higher rent growth in a couple of years, it would be at the expense of any improvements to affordability.
There are existing policy tools that encourage the development of badly needed housing that will expand supply and lower housing costs such as voluntary inclusionary zoning, tax abatement, and accelerated building permit approval processes. The NMHC Housing Affordability Toolkit provides steps for policymakers to enact these policies, as well as many others.
About Research Notes: Published quarterly, Research Notes offers exclusive, in-depth analysis from NMHC's research team on topics of special interest to apartment industry professionals, from the demographics behind apartment demand to the effect of changing economic conditions on the multifamily industry.
Questions or comments on Research Notes should be directed to Chris Bruen, Sr. Director of Research, NMHC, at cbruen@nmhc.org or NMHC Research Analyst, Ryan Hecker at rhecker@nmhc.org.


