

By Chris Bruen
Chris Bruen is Senior Director of Research, with primary responsibility for aiding in and expanding upon NMHC’s research in housing and economics. Chris holds a bachelor’s degree in Finance from The George Washington University and an M.S. in Economics from Johns Hopkins University. He can be reached at cbruen@nmhc.org.
There have already been nearly 500 thousand multifamily units (496.6 thousand) built this year, according to data from the U.S. Census Bureau — more than in all of 2023, which saw the highest number of deliveries since the late 1980s. We have yet to even receive construction data for November and December of this year.
Much of this new development has consisted of higher-end apartments. Approximately 77% of 2024 apartment deliveries were assigned 4- or 5-Star ratings by CoStar (a 5-Star rating indicating the absolute highest quality in design and construction); 22.4% were rated as 3 stars; while less than 1% (0.4%) of 2024 deliveries fell into the lower-quality (but also most affordable) 1- and 2-Star categories.
This is nothing new. In fact, between 2015 and 2019, 84% of all apartment deliveries were categorized as 4- or 5-Star units, according to CoStar.
While the U.S. currently has a shortage of millions of homes, many have questioned whether this higher-end development has had a positive impact on affordability, especially for lower-income households. In this Research Notes, we examine the effect that these new, largely higher-end apartments have had on rent growth among more affordable, lower- to mid-quality buildings over the past decade.
We find that between 2015 and 2024, markets with higher levels of supply tended to record lower rates of rent growth among 1- and 2-Star apartments, even after controlling for various measures of demand and metro-level differences.
1-, 2-, and 3-Star Apartments
Apartments assigned 1-, 2-, or 3-Star ratings by CoStar include the bulk of our nation’s naturally occurring affordable housing stock — as in, housing that is affordable to most households without any government subsidy. Effective asking rents in the third quarter of 2024 averaged $1,321 per month among 1- and 2-Star apartments and $1,579 per month among 3-Star apartments, a fraction of the average rents reported for 4-star apartments ($2,049 per month) and 5-Star apartments ($2,980 per month).
But this discount has eroded somewhat over the years. Effective asking rents for apartments rated as 1- and 2-Star have grown by an average annual rate of 3.4% over the past 11 years. Units in the 4- and 5-Star category, while more expensive overall, have seen their rents grow at a much slower pace, averaging just 2.7% annually over the same period. 3-Star apartments, meanwhile, recorded the fastest rate of rent growth of the three groupings, averaging 3.8% annually from 2013 to 2024.
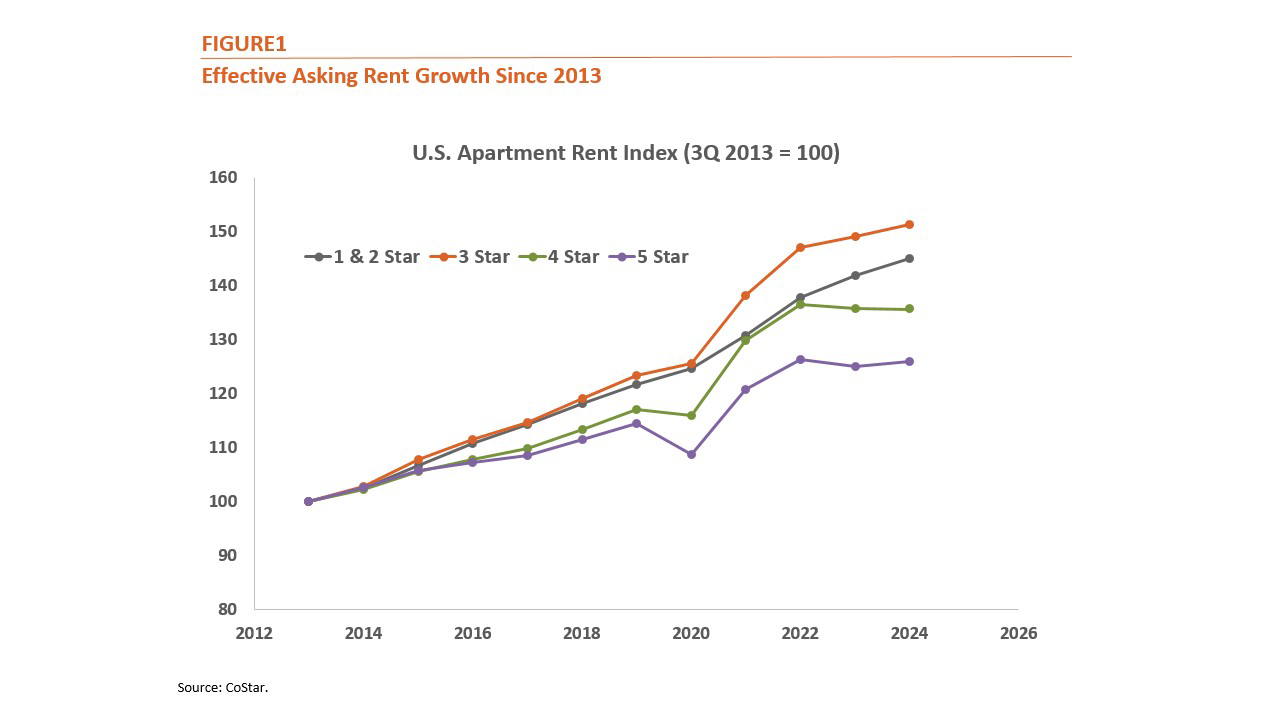
Furthermore, 1-, 2-, and 3-Star units represent an ever-decreasing share of the overall apartment stock — falling from 39.0% of apartments in 1Q 2014 to under a third (30.3%) in 3Q 2024 — as 4- and 5-Star units make up the vast majority of new development.
The Relationship Between High-End Development and Rent Growth
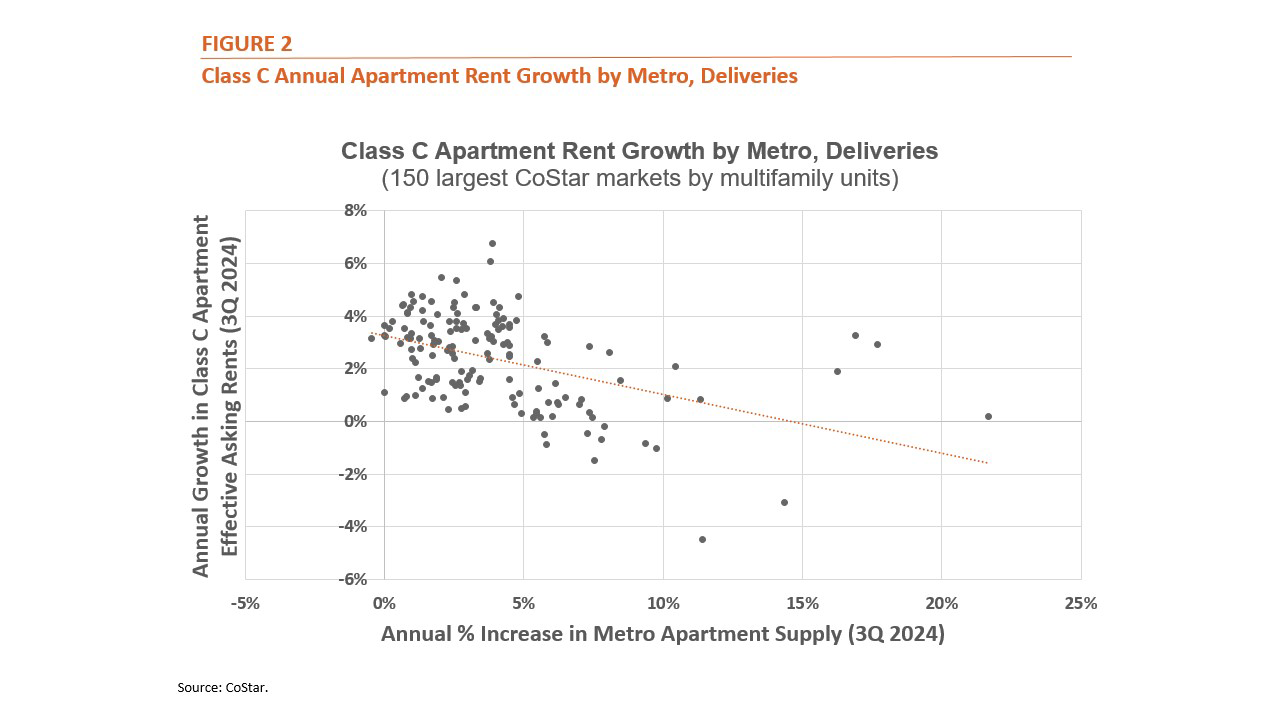
This dual trend of increased high-end development and rising rents, especially among more affordable units, can lead many to assume a causal relationship: that new, higher-end development is, in fact, a driving force behind worsening affordability. This relationship, however, does not include a crucial element: that demand is often outstripping supply, causing rents to increase. Previous work by Myers and Park indicated that from 2000 to 2018, rents in lower classes increased due to demand outstripping supply overall. And in our June Research Notes, we found that markets with higher levels of multifamily deliveries over the past year also tended to record lower rent growth among Class C (largely 1- and 2-Star units) rent growth.
This is consistent with the theory that higher-end development relieves pressure from other segments of the market, a phenomenon known as “filtering”. After all, the historic levels of development categorized as 4- and 5- star apartments absorbed nearly 400 thousand new households (398,337) over the past twelve months — and more than 1.6 million new households over the past five years — households that otherwise might have driven up prices in the 1-, 2- and 3-Star space.
A More Sophisticated Model — Going Beyond a Simple Correlation
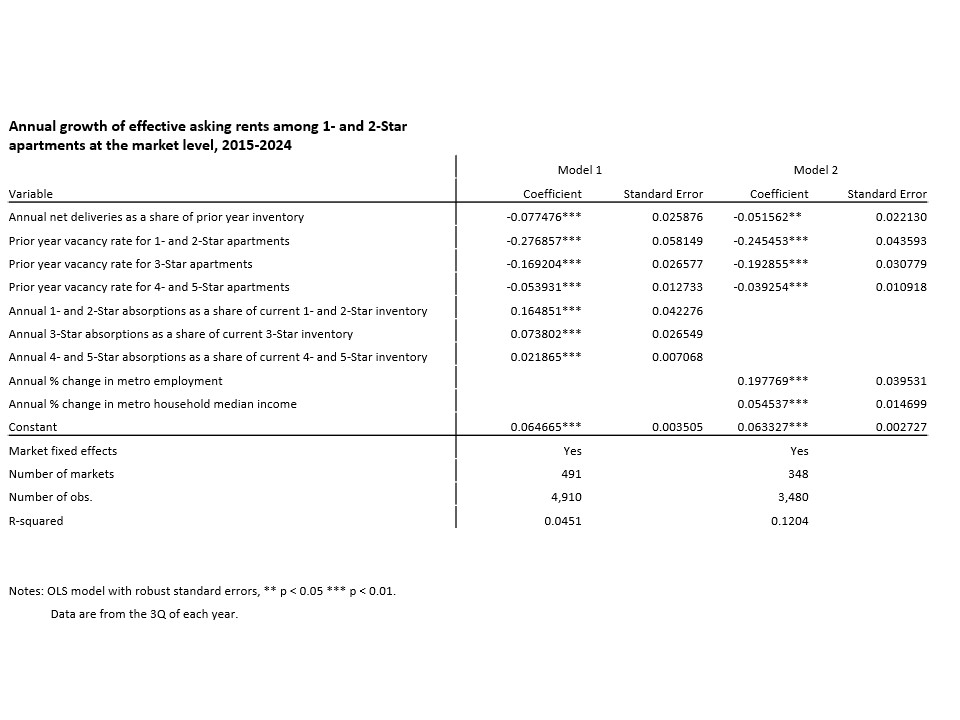
Still, the simple correlation found in the previous Research Notes, between new supply and Class C rent growth across metro areas at one point in time, ignores several important factors that also affect rent growth. We attempted to control for these factors using a more comprehensive statistical model, which utilizes CoStar data across 491 markets and 10 years (2015-2024).1 Our aim was to determine whether this relationship between new supply and 1- and 2-Star rent growth still holds true after accounting for the effect of apartment demand and other metro-level factors.
- Demand
It is not so much new supply that should affect rent growth, but new supply relative to demand. Because apartment developers tend to respond to higher levels of demand with more supply, these two variables are highly connected. While apartment demand cannot be observed directly, we attempt to account for its effect by looking at absorptions (the net number of new apartments leased over a 12-month period) and, separately, at metro-level employment growth and income growth. While using different measurements of demand results in slightly different estimates, both point to demand having a significant impact on rent growth in 1- and 2-Star apartments.
When we used absorptions to account for demand, we found that higher demand for all types of apartments (1- and 2-Star, 3-Star, and 4- and 5-Star apartments) translated to higher rent growth for apartments rated 1-or 2-stars.
More specifically, we found that 1- and 2-Star rent growth was approximately 16.7 basis points (bps) higher for every percentage point increase in 1- and 2-Star absorptions as a share of inventory, 7.4 bps higher for every percentage point increase in 3-Star absorptions as a share of inventory, and 2.2 bps higher for every percentage point increase in 4- and 5-Star absorptions as a share of inventory.In a separate analysis, we found that markets with higher year-over-year employment growth and income growth (an alternative measure of demand to absorptions) tended to record higher rates of rent growth among apartments rated 1- or 2-Stars.
More specifically, we found that 1- and 2-Star rent growth was approximately 19.8 bps higher for every percentage point increase in a market’s total annual employment growth and 5.5 bps higher for every percentage point increase in a market’s annual median household income growth.
- Existing supply/demand dynamics
Markets that are already suffering from more severe apartment shortages, characterized by lower vacancy rates, might still record higher levels of rent growth in spite of higher levels of annual deliveries. Similarly, markets that are relatively oversupplied, and in the process of leasing up a large number of vacant apartments, might still record lower rent growth at the same time as lower levels of new completions. We attempt to control for the effect of existing, market-level supply and demand dynamics by incorporating the previous year’s vacancy rate into our model.
In both of our model specifications, which use absorptions and (separately) employment growth and income growth as measures of demand, we found that higher apartment vacancy rates in the previous year, across all product types, were associated with lower rates of annual rent growth for 1- and 2-Star apartments.
In other words, even vacancy rates for high-end apartments appeared to impact rent growth in the more affordable segment of the market.
We found that 1- and 2-Star rent growth was approximately 24.5 to 27.7 bps lower (depending on the model) for every percentage point increase in the previous year’s 1- and 2-Star apartment vacancy rate, 16.9 to 19.3 bps lower for every percentage point increase in the previous year’s 3-Star vacancy rate, and 3.9 to 5.4 bps lower for every percentage point increase in the previous year’s 4- and 5-Star vacancy rate.
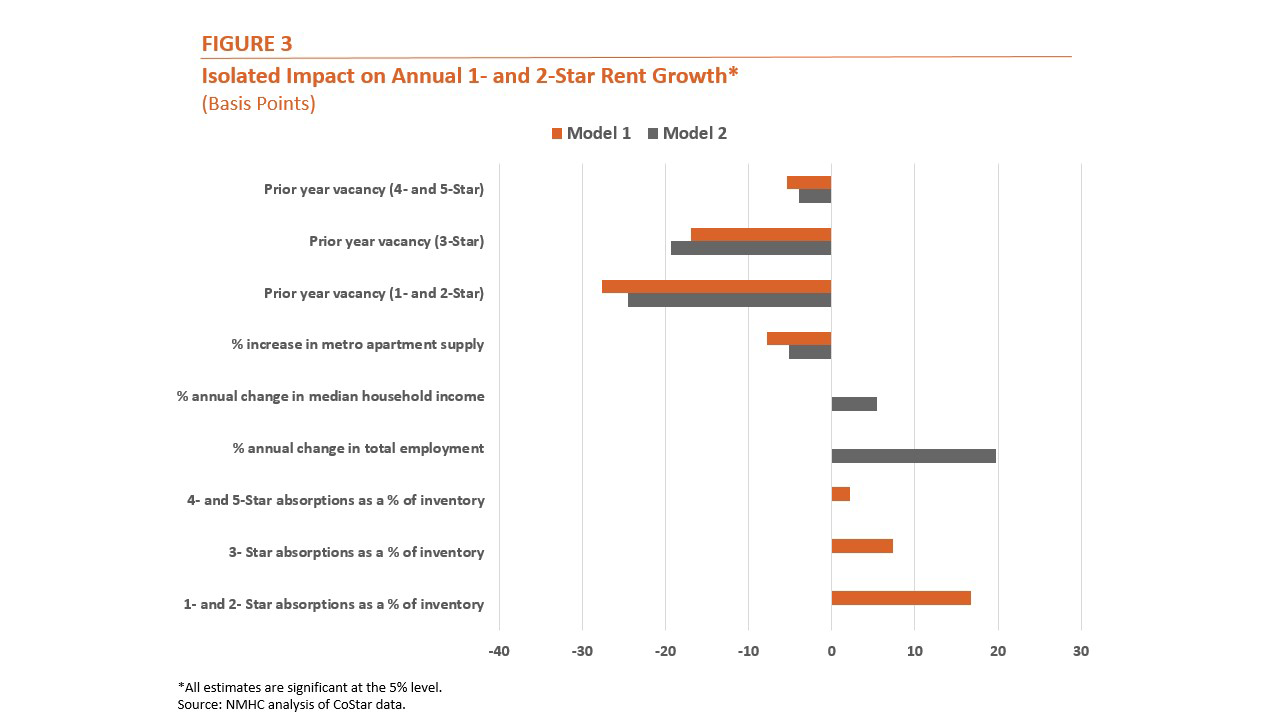
Most importantly, however, were our findings related to new apartment supply. After controlling for demand and the previous year’s vacancy rate, we found that higher levels of supply (almost all of which was 3-Star and above) were associated with lower 1- and 2-Star rent growth at the metro level. More specifically, we estimated that metro 1- and 2-Star rent growth was anywhere from 5.2 to 7.7 basis points lower for every percentage point increase in a metro’s annual apartment inventory growth.
1 We included all markets tracked by CoStar except for those with missing observations for any of the variables included in our model. Our second model only used data from 348 markets due to more limited availability of employment and income figures from CoStar.
Rent Growth is Slowed Across the Board When New Supply is Introduced
Our analysis provides strong evidence that the development of new, high-end apartments results in lower rent growth among all apartments, even more affordable 1- and 2-Star units. More broadly, our results suggest that what happens at the higher-end of the market influences lower-end apartments as well: higher demand for 4- and 5-Star apartments leads to higher rent growth among 1- and 2-Star units, and higher vacancy in the 4- and 5-Star space leads to lower rent growth among 1- and 2-Star units.
While the most direct way to preserve affordability at the lower-end of the apartment market would be to simply build more lower-end, 1- and 2-Star apartment units, these types of projects rarely pencil out in the absence of some sort of subsidy due to significant development costs. Our analysis shows, however, that even higher-end development should help to relieve rent pressures among more affordable class types, albeit to a lesser degree.
Questions or comments on Research Notes should be directed to Chris Bruen, NMHC Sr. Director of Research, or NMHC Research Analyst, Ryan Hecker.